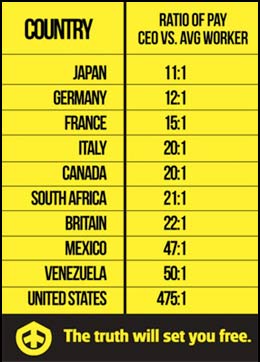
Many people have seen the chart shown here, which “went viral” not long ago. Now the site where it appears carries an afternote from Lisa Wade, who says:
Since posting this, I’ve discovered that the numbers do not accurately reflect the ratio of CEO vs. worker pay. I apologize for not vetting this more carefully.
What happened was, a website called PolitiFact discovered that the chart originated with three graduate students in 2005 who forgot to list sources for their data, which by now would be more than 10 years old anyway. Fair enough.
It appears that no official body keeps track of the comparative CEO/worker rates of compensation internationally, so that’s a dead end. But even without solid verification, PolitiFact admits:
We don’t doubt the chart’s underlying point that the ratio of CEO pay to worker pay is high in the United States, and is likely higher in our free-wheeling economy than it is in the historically more egalitarian nations of Europe.
They also warn that even in the best case, statistics can only be approximated, because of differences in surveying methods and subjective decisions like what counts as compensation. But the story really gets interesting when PolitiFact seeks out current numbers regarding the income inequality between the CEO of an American company and the average worker in that company.
Here is what they found:
The most recent chart from the Economic Policy Institute shows a ratio of 185 to 1 for 2009. According to the group’s calculations, the peak since the mid 1960s was almost 299 to 1… Meanwhile, the most recent ratio from the Institute for Policy Studies is also smaller — for 2010, it was 325 to 1. In previous years the ratio on two occasions has exceeded 475 to 1 — to be specific, 516 to 1 in 1999 and 525 to 1 in 2000.
So they imply that we should calm down about this income inequality thing, because it was worse in 2000. Sure, the pay differential was even more outrageous than the number shown on the chart, but this information “would be of questionable use to policy debates today.”
Who are they kidding? We’re supposed to shun this chart because it’s wrong — but it’s wrong in the wrong direction! When the big boss makes 525 times as much as the worker, that’s worse than the big boss making 475 times as much as the worker!
Maybe it’s true that the most conservative number is closest to being right. Maybe the average American CEO only makes 185 times as much as the worker, a number that PolitiFact says was “not generated by groups that might have an ideological interest in downplaying the gaps between rich and poor.” So we’re supposed to chill out and not be concerned about the fact that for every dollar a worker makes, the big boss makes $185 of them.
Eileen Appelbaum notes that there is a difference between the official national unemployment level of 12.7 million and the actual number of unemployed, which is 22.8 million, if you count people who have given up searching for work, and the part-time employed who would be working full-time if they could. She is suspicious of employers who claim to “have good jobs but can’t find workers with the right skills to fill them.” If such an urgent imbalance exists between supply and demand, she wonders, then why isn’t this reflected by a rise in pay for these jobs?
Appelbaum gives a summary of recent research about the aftermath of an economic recession. High-paying and low-paying jobs come back, but, she adds:
A new study attributes the jobless recoveries following recent recessions to such job polarization. The study’s authors argue that jobs in the middle of the skill and income distribution disappear during recessions and fail to come back during recoveries.
However, in some areas of the low-skill-and-income-sector, the job outlook is perking up. According to the Bureau of Labor Statistics, personal care and home health aides are the fastest growing categories of workers being sought.
Last week, House the Homeless discussed the “silver tsunami,” the demographic bulge of seniors and pre-seniors who will soon require the attention of many thousands of personal care aides and home health aides. They are honorable professions, but the pay scale is not tempting.
Since the financial reward is paltry, we had better hope that a whole lot of young people feel motivated to enter the caregiver business through their own natural good-heartedness. Where is all this good-heartedness going to come from? We’re raising a nation of kids whose families are fractured by homelessness, whose human ties are fragile and constantly broken by the necessity to move yet again.
These disadvantaged kids are proceeding to grow up into the very workforce that will be spoonfeeding oatmeal to the Baby Boom generation a few years from now. We’d better hope they learn about the milk of human kindness somewhere along the way.
Reactions?
Source: “Cross-National Comparison of Ratio of CEO to Worker Pay,” The Society Pages, 05/03/12
Source: “Viral Facebook post on CEO-worker pay ratio has obscure past,” PolitiFact, 10/10/11
Source: “Low-Wage Jobs to Blame for Slow Economic Recovery,” NationofChange, 04/10/12
Image of “Cross-National Comparison of Ratio of CEO to Worker Pay” is used under Fair Use: Reporting.
